Reporting & DASHBOARDS
Get Answers and Insights

Intuitive Reports & Dashboards
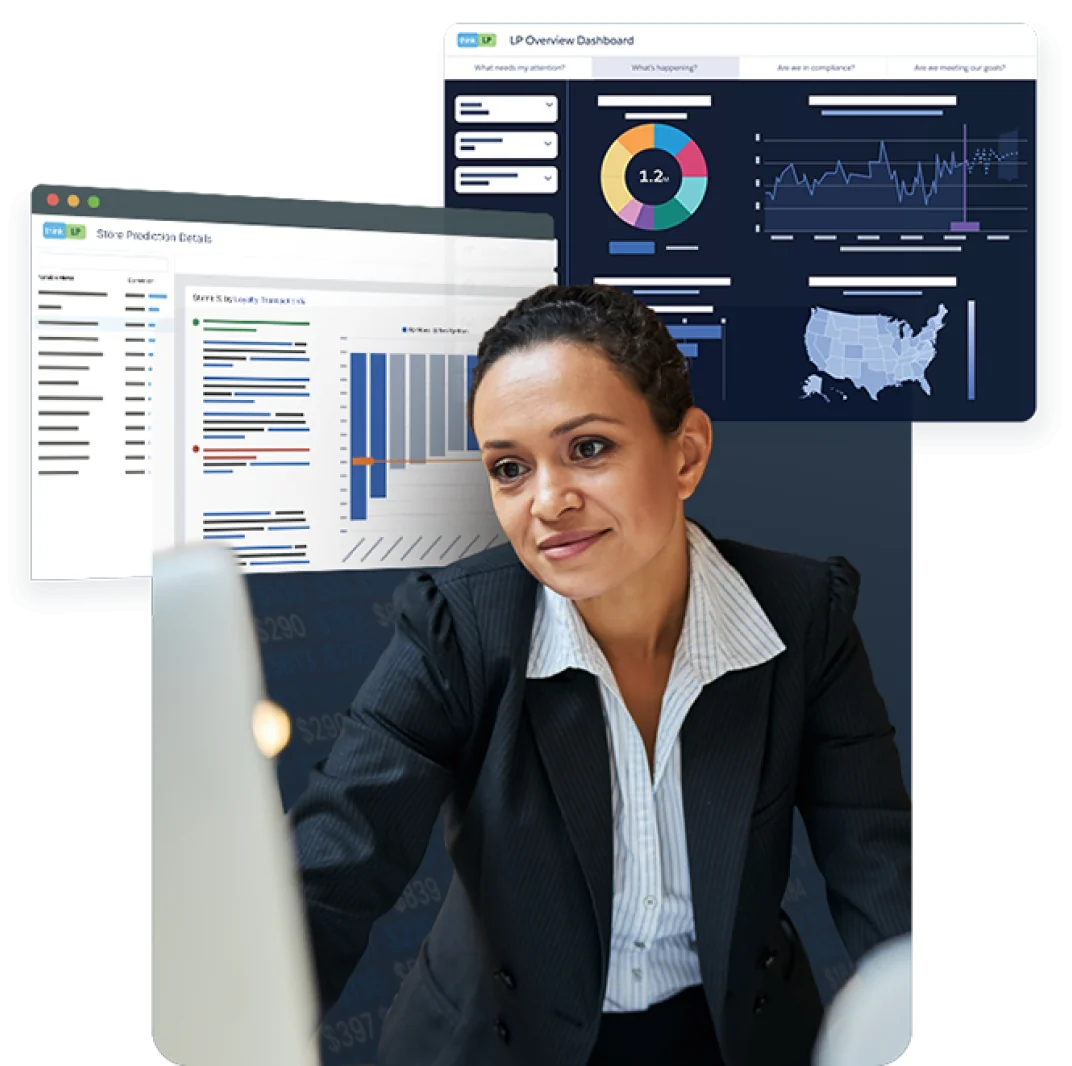
- Powerful and configurable dashboards provide a comprehensive overview of your data. Subscribe to dashboard components to be updated when thresholds are crossed. Drilldown by any field to find the details you’re looking for.
- Create reports, add highlights and graphs, and publish them with drill-down capabilities. Do it all with simple drag-and-drop editors.
- Present data in various formats like bars, gauges, plots, and donuts. View animated data and explore further by clicking on any element.
- Easily create custom views of your data for quick access, such as “Recent Investigations” or “High Value Cases”. Customize the fields and filters used in the view, and keep the view private or publish it so others can take advantage of your genius.
Take Action from Analysis
- Easily collaborate by sharing data and mentioning co-workers, in-context, and around your data to drive continuous improvement in your organization.
- View your locations on maps, color coded according to shrink level. Click on a store to view outstanding investigations and case values, and track all activities associated with the location – including BOPIS/BORIS.
- Create your reports once and use them everywhere: by themselves, on a dashboard, on a home page, on your location profiles, on your mobile device, and more!


Built for your enterprise
- Receive a snapshot of your dashboard automatically and never be caught with out-of-date information.
- Secure, tailored access to reporting. Users see all permitted data columns, while restricted ones are automatically hidden, enabling worry-free, standardized report publishing across profiles.
- Save time by embedding external links on dashboards so your users can take data-driven action anywhere it needs to take place.
GET STARTED
Find time with us to learn more
Testimonial
“We know that ThinkLP is saving a substantial amount of time helping us generate reports. The reporting from ThinkLP also helps us target areas that need attention, which helps us reduce shrink as well.”
Fortune 50 Home Improvement Retailer


