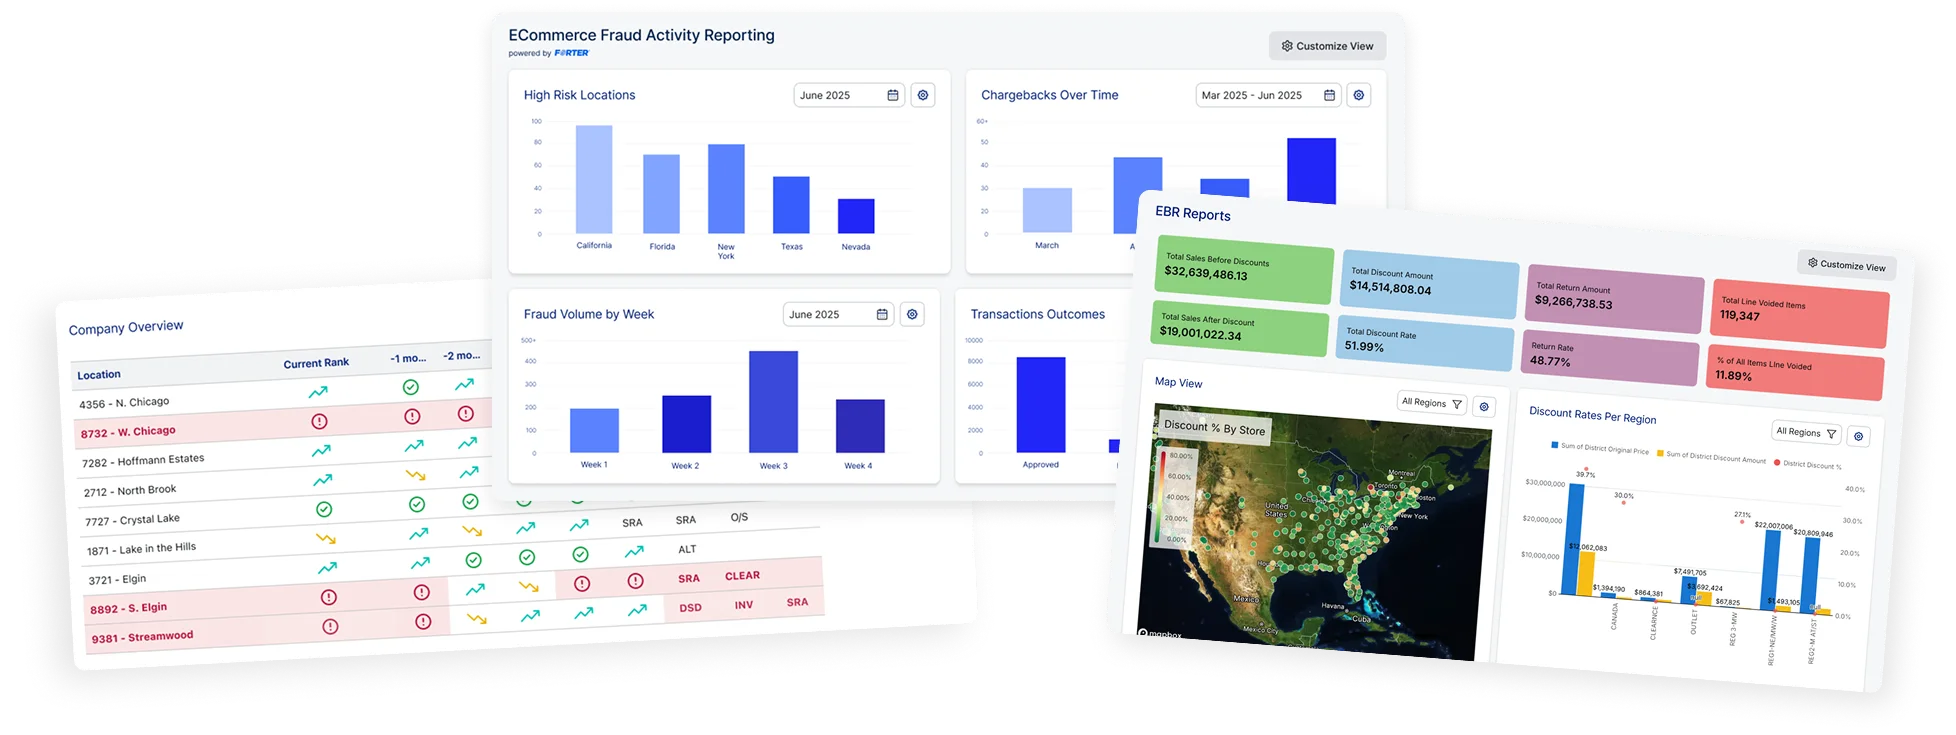
See What’s Next. Act With Certainty.
Guided Action. Measurable Results.
Think360 doesn’t just show you what’s happening, it tells you exactly what to do next. Powered by built-in accountability, Think360 guides every team member to the next best action and closes the loop with automatic follow-up. That’s how retail teams protext profit, reduce loss, and delibver real results, fast.

Turn Data Overload Into Profit-Driving Action
Retailers aren’t struggling with a lack of data–they’re overwhelmed by it. Data is scattered across audits, case management, store systems, and more. The real challenge? Knowing what to do next. Think360 unifies data and turns it into guided action. With alerts, assignments, and automatic follow-up to ensure resolution. No more spreadsheets. No more guesswork.
Use natural language to ask questions, surface trends, and take immediate action based on prioritized, role-specific insights. Every alert is actionable. Every task is tracked. Every resolution improves your P&I.
What Your Business Looks Like With Think360
Close the loop between insight and execution—every time.
Protection
Shrink drops as issues are detected and resolved before they escalate.
Growth
Sales and margins increase as operations run smoother and stockouts decrease.
Accountability
Every task is assigned, tracked, and audited. You’ll know exactly what’s working.
Efficiency
Teams reclaim hours every week with AI-powered search and automated reporting.
Drive Outcomes That Matter

Think360 doesn’t just surface insights, it drives the right action that reduces shrink, improves compliance, and grows margins.
Up to 20% reduction in shrink.
Over 30% time savings for LP and Ops teams.
Full visibility into sales, in-stock rates, and compliance.
Every insight tied directly to your profit and loss (P&L).
A Platform That Ticks all the Boxes
Compare Think360 to other tools on the market.
| Required Capability | Think360 | How do we better & different (Value Framework) |
|---|---|---|
| Predictive Scorecards | Think360 employs AI-driven modeling to assess and prioritize issues related to financial and operational risks, offering predictive scorecards that provide insights beyond mere reporting. | |
| Guided, next-best actions | Action-oriented intelligence recommends role-specific, next steps based on data, impact and context ensuring users don’t just see data, they know what to do. | |
| Closed-loop accountability | Built-in alerting and case triggers link insight to action, tracking whether intervention occurred and tying it back to outcomes. Full visibility across execution. | |
| Plain-English search/report | Think360’s AI Assistant enables natural language search and automated reporting - no SQL or analyst needed. Anyone can ask and understand. | |
| Unified platform | One central hub combining case management, audits, analytics and alerts. Think360 eliminates silos so teams can act faster, together! | |
| Field-focused Scorecards | Scorecards are tailored by role; field teams see store-level tasks, leaders see big-picture metrics. Everyone sees what matters to them. | |
| Measurable ROI | Financial impact is baked in; risk is prioritised by cost, and intervention is tracked to resolution—tying every insight to real outcomes. | |
| No technical skills needed | From setup to usage, Think360 is built for non-technical users. Automated reports, plain-English search and AI guidance lower the barrier to insight. |
See Results That Matter
Think360 customers consistently report lower shrink, stronger margins, and more efficient operations—often within the first quarter.
“Think360 saves us a substantial amount of time, and more importantly, it tells us where to focus. We’re not digging through data anymore—we’re acting on it. That’s helped us reduce shrink and make a real impact on the bottom line.”

